Kubernetes cluster observability with Prometheus and Grafana on Creodias
Complex systems deployed on Kubernetes take advantage of multiple Kubernetes resources. Such deployments often consist of a number of namespaces, pods and many other entities, which contribute to consuming the cluster resources.
To allow proper insight into how the cluster resources are utilized, and enable optimizing their use, one needs a functional cluster observability setup.
In this article we will present the use of a popular open-source observability stack consisting of Prometheus and Grafana.
What Are We Going To Cover
Install Prometheus
Install Grafana
Access Prometheus as datasource to Grafana
Add cluster observability dashboard
Prerequisites
No. 1 Hosting
You need a Creodias hosting account with Horizon interface https://horizon.cloudferro.com/auth/login/?next=/.
No. 2 A cluster created on cloud
Kubernetes cluster available. For guideline on creating a Kubernetes cluster refer to How to Create a Kubernetes Cluster Using Creodias OpenStack Magnum.
No. 3 Familiarity with Helm
For more information on using Helm and installing apps with Helm on Kubernetes, refer to Deploying Helm Charts on Magnum Kubernetes Clusters on Creodias
No. 4 Access to kubectl command line
The instructions for activation of kubectl are provided in: How To Access Kubernetes Cluster Post Deployment Using Kubectl On Creodias OpenStack Magnum
1. Install Prometheus with Helm
Prometheus is an open-source monitoring and alerting toolkit, widely used in System Administration and DevOps domains. Prometheus comes with a timeseries database, which can store metrics generated by variety of other systems and software tools. It provides a query language called PromQL to efficiently access this data. In our case, we will use Prometheus to get access to the metrics generated by our Kubernetes cluster.
We will use the Prometheus distribution delivered via the Bitnami, so the first step is to download Bitnami to our local Helm repository cache. To do so, type in the following command:
helm repo add bitnami https://charts.bitnami.com/bitnami
Next, download the Prometheus Helm chart:
helm install prometheus bitnami/kube-prometheus
With the above commands correctly applied, the result should be similar to the following:
NAME: prometheus
LAST DEPLOYED: Thu Nov  2 09:22:38 2023
NAMESPACE: default
STATUS: deployed
REVISION: 1
TEST SUITE: None
NOTES:
CHART NAME: kube-prometheus
CHART VERSION: 8.21.2
APP VERSION: 0.68.0
Note that we are deploying the Helm chart to the default namespace for simplicity. For production, you might consider using a dedicated namespace.
Behind the scenes, several Prometheus pods are launched by the chart, which can be verified as follows:
kubectl get pods

...

NAME                                                            READY   STATUS    RESTARTS   AGE
alertmanager-prometheus-kube-prometheus-alertmanager-0          2/2     Running   0          2m39s
prometheus-kube-prometheus-blackbox-exporter-5cf8597545-22wxc   1/1     Running   0          2m51s
prometheus-kube-prometheus-operator-69584c98f-7wwrg             1/1     Running   0          2m51s
prometheus-kube-state-metrics-db4f67c5c-h77lb                   1/1     Running   0          2m51s
prometheus-node-exporter-8twzf                                  1/1     Running   0          2m51s
prometheus-node-exporter-sc8d7                                  1/1     Running   0          2m51s
prometheus-prometheus-kube-prometheus-prometheus-0              2/2     Running   0          2m39s
Similarily, several dedicated Kubernetes services are also deployed. The service prometheus-kube-prometheus-prometheus exposes the Prometheus dashboard. To access this service in the browser on default port 9090, type in the following command:
kubectl port-forward svc/prometheus-kube-prometheus-prometheus 9090:9090
Then access your browser via localhost:9090 to see the result similar to the following:
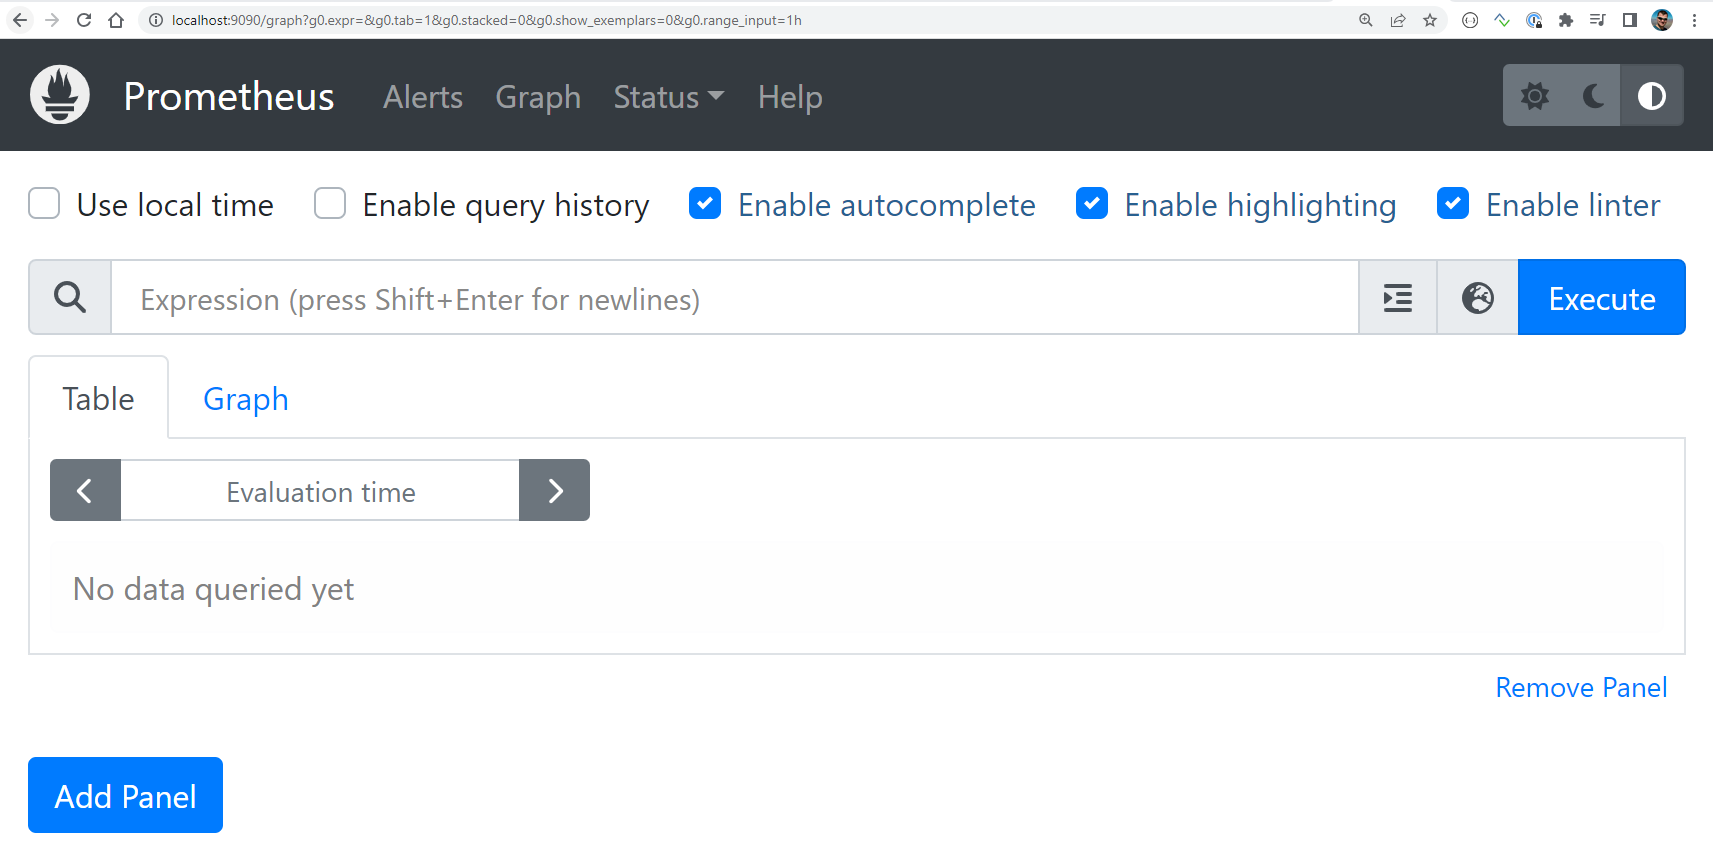
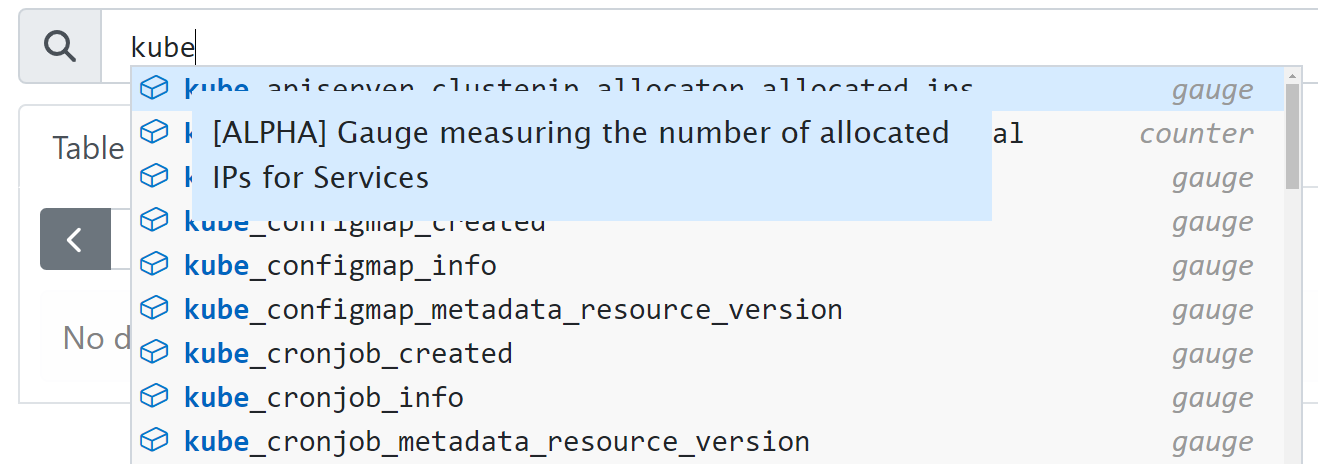
Notice, when you start typing kube in the search results, the autocomplete suggest some of the metrics that are available from our Kubernetes cluster. Along with the Helm chart installation, these metrics got exposed to Prometheus, so they are stored in Prometheus database and can be queried for.
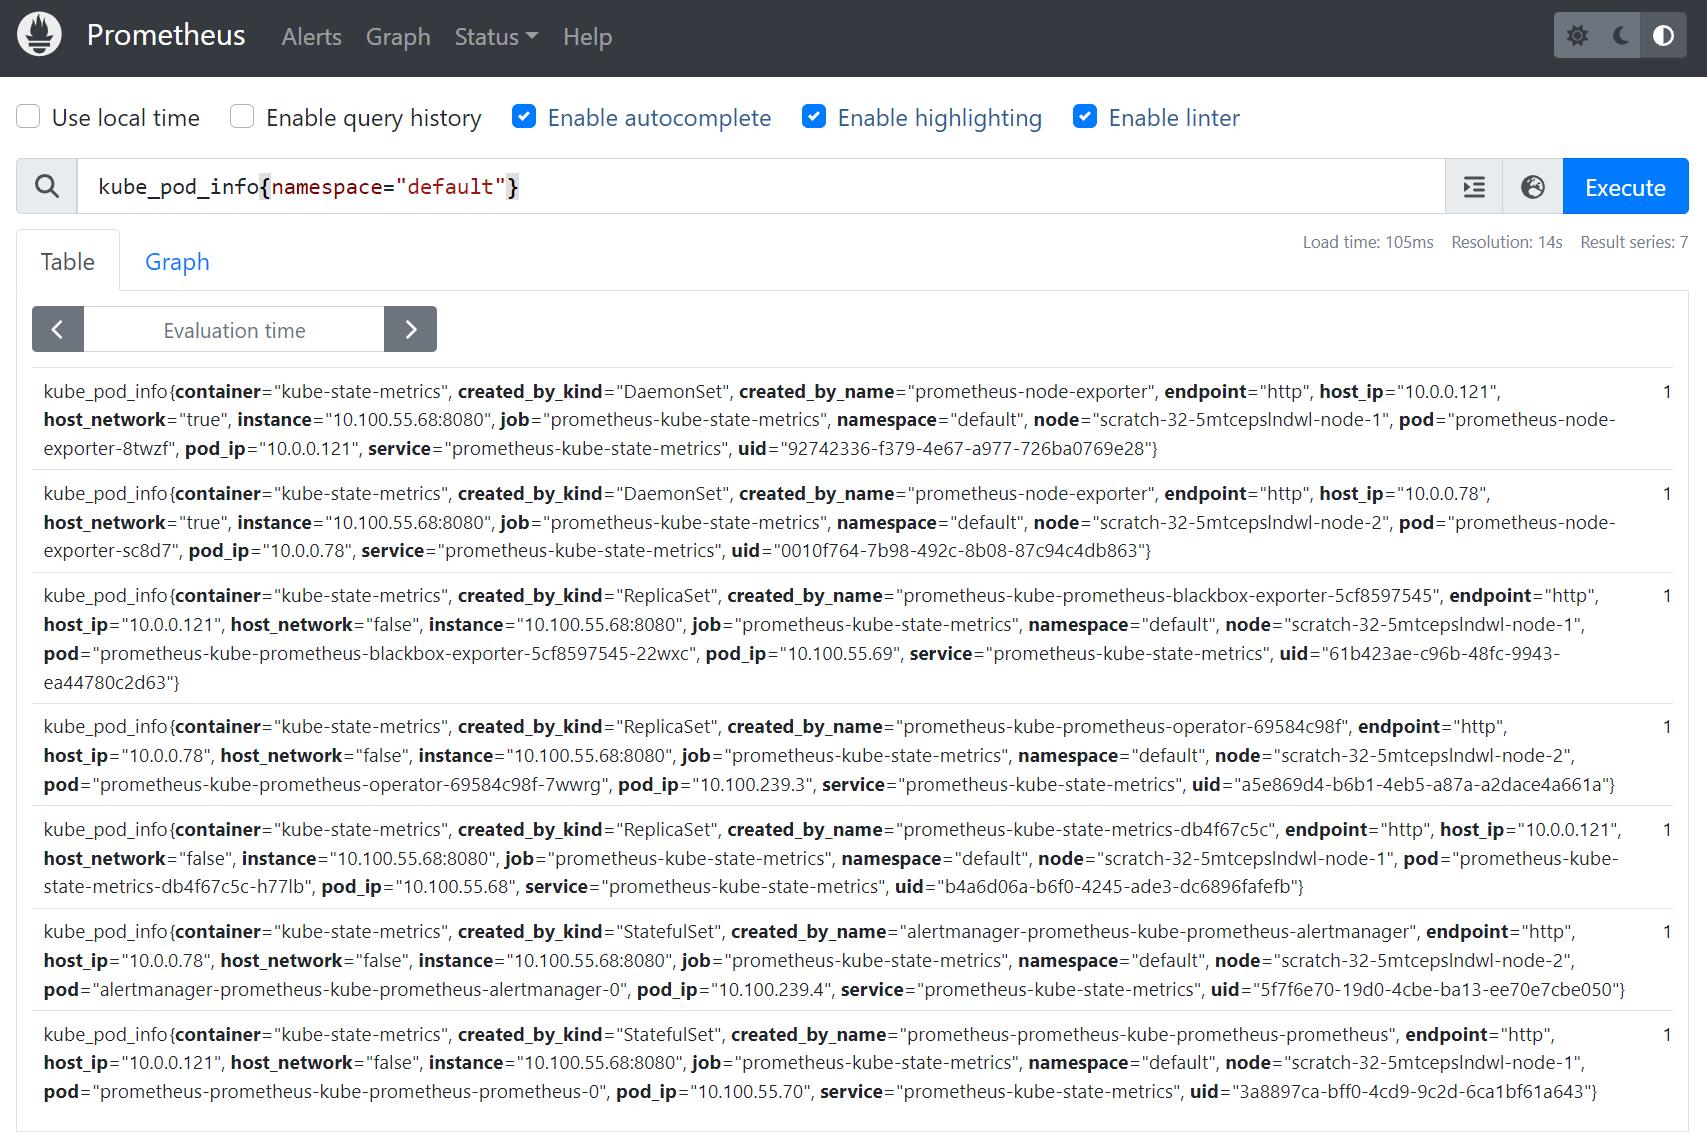
You can select one of the metrics and hit Execute button to process the query for statistics of this metrics. For example, insert the following expression
kube_pod_info{namespace="default"}
to query for all pods in the default namespace. (Further elaboration about the capabilities of Prometheus GUI and PromQL syntax is beyond the scope of this article.)
2. Install Grafana
The next step is to install Grafana. We already added the Bitnami repository when installing Prometheus, so Grafana repository was also added to our local cache. We only need to install Grafana.
Note that if you want to keep an active browser session of Prometheus from the previous step, you will need to start another Linux terminal to proceed with the below installation guideline.
By default, Grafana chart will be installed with a random auto-generated admin password. We can overwrite one of the Helm settings to define our own password, in this case: ownpassword, for simplicity of the demo:
helm install grafana bitnami/grafana --set admin.password=ownpassword
If you prefer to stick to the defaults, instead of the above command, use the following commands to install the chart and extract the auto-generated password:
helm install grafana bitnami/grafana
echo "Password: $(kubectl get secret grafana-admin --namespace default -o jsonpath="{.data.GF_SECURITY_ADMIN_PASSWORD}" | base64 -d)"
There will be a single pod generated by the chart installation. Ensure to wait until this pod is ready before proceeding with the further steps:
kubectl get pods

NAME                                                            READY   STATUS    RESTARTS   AGE
...
grafana-fb6877dbc-5jvjc                                         1/1     Running   0          65s
...
Now, similarly as with Prometheus we can access Grafana dashboard locally in the browser via the port-forward command:
kubectl port-forward svc/grafana 8080:3000
Then access the Grafana dashboard by entering localhost:8080 in the browser:
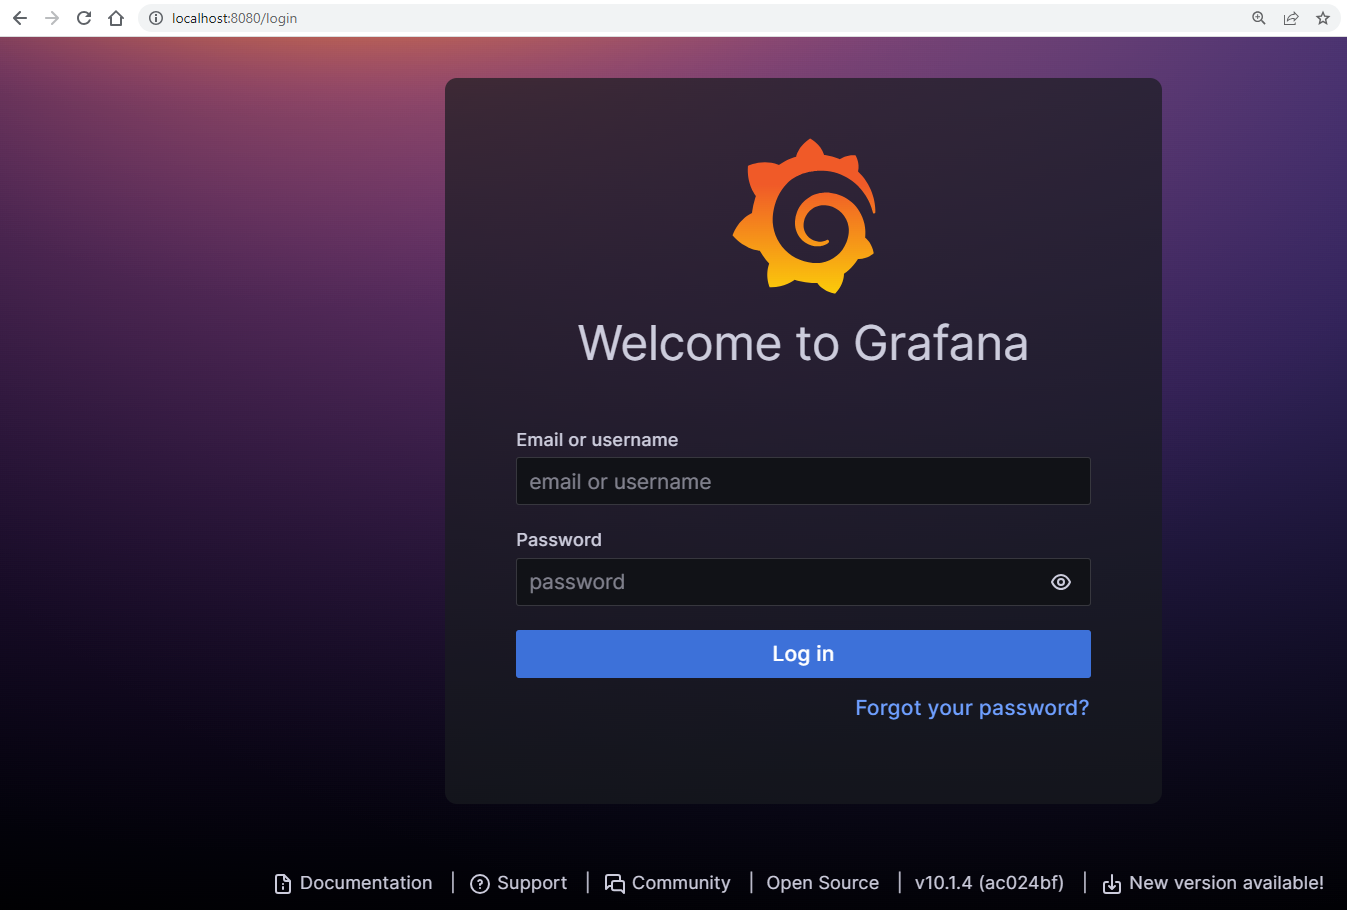
Type the login: admin and the password ownpassword (or the auto-generated password you extracted in the earlier step).
3. Add Prometheus as datasource to Grafana
In this step we will setup Grafana to use our Prometheus installation as a datasource.
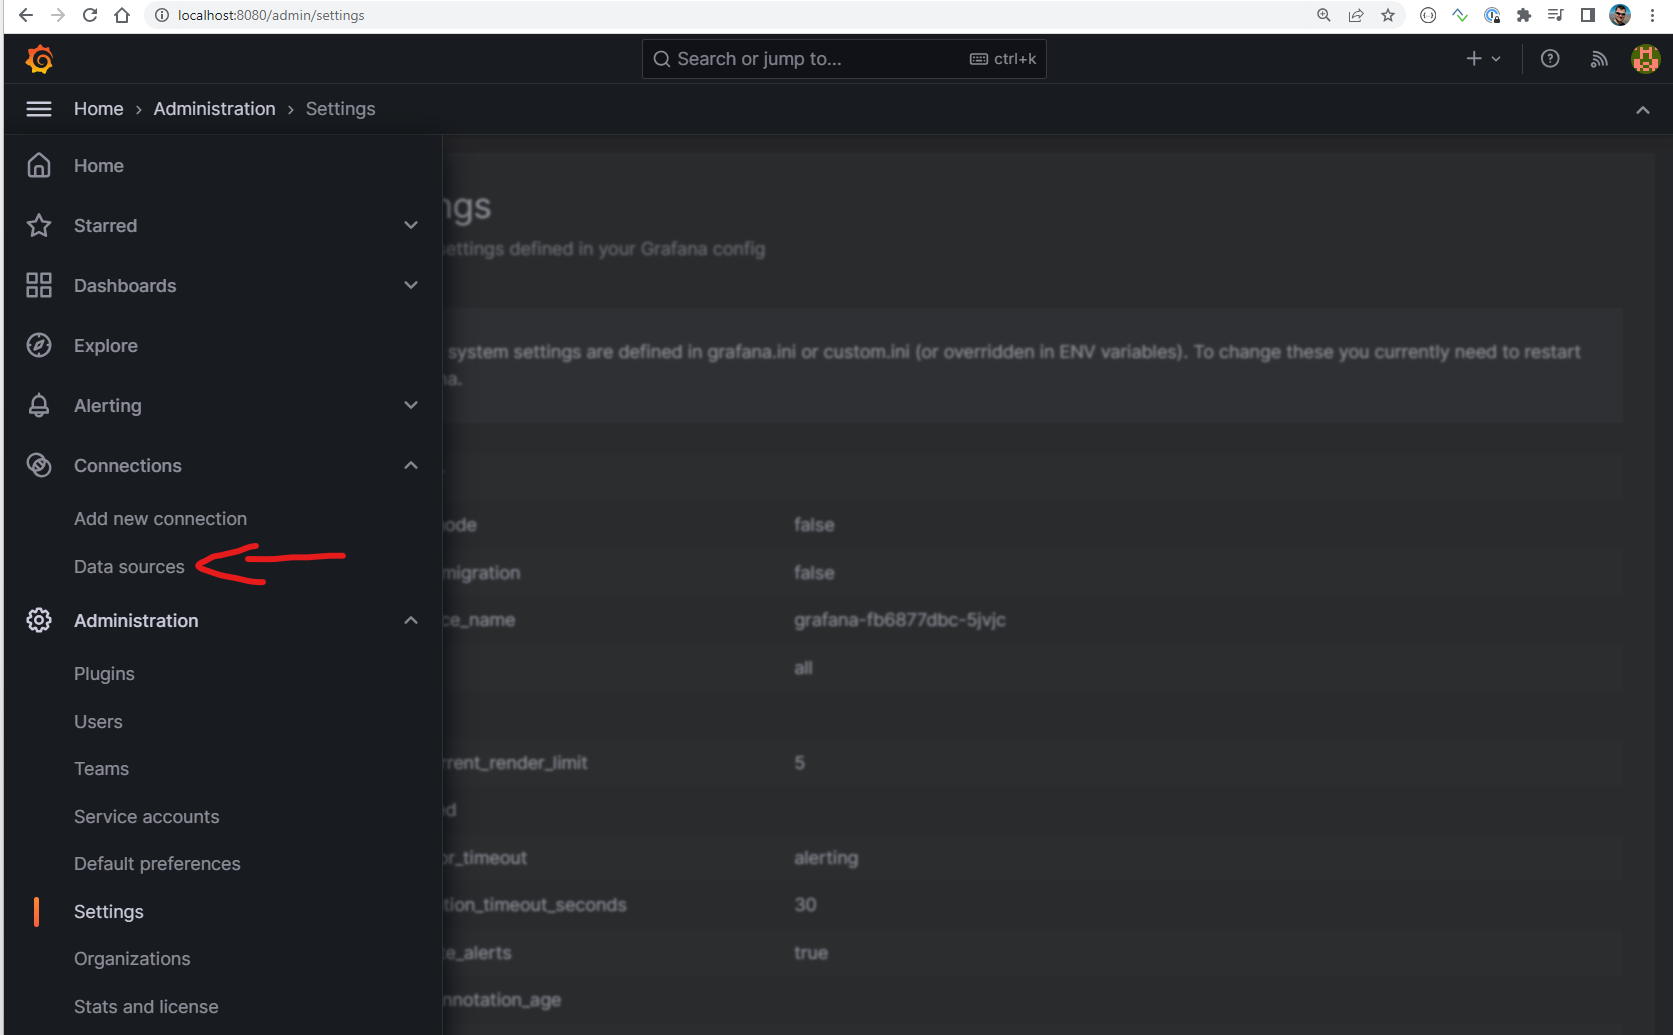
To proceed, click on Home menu in the left upper corner of Grafana UI, select Connections and then Data sources:
Then select Add data source and choose Prometheus as datasource type. You will enter the following screen:
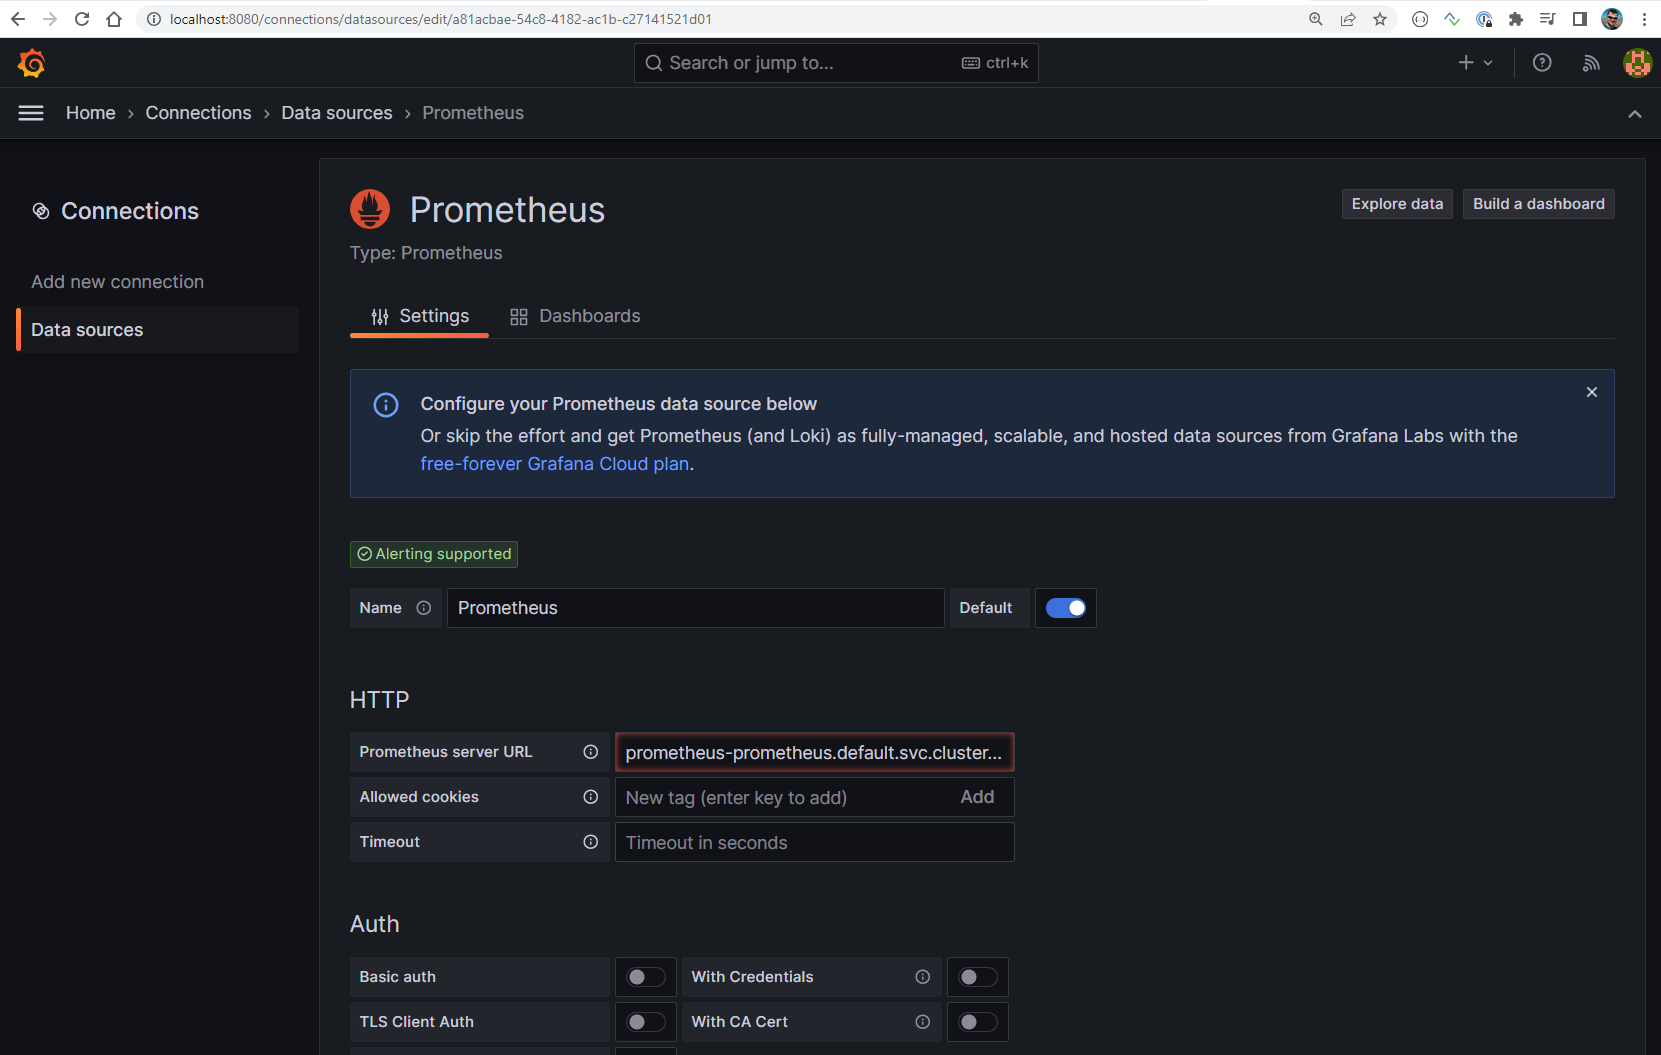
Just change “Prometheus server URL” field to http://prometheus-kube-prometheus-prometheus.default.svc.cluster.local:9090 which represents the address of the Prometheus Kubernetes service in charge of exposing the metrics.
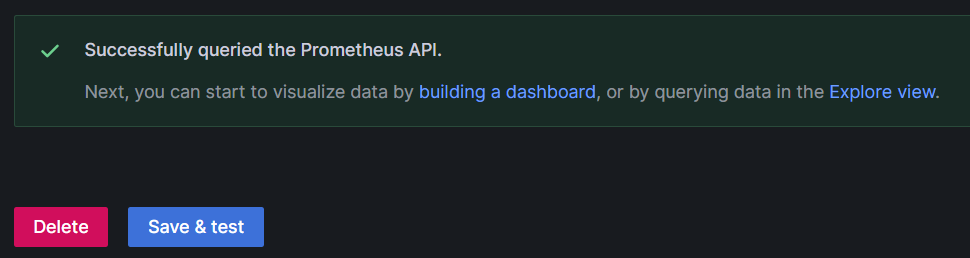
Hit the Save and test button. If all went well, you will see the following screen:
4. Add cluster observability dashboard
We could be building a Kubernetes observability dashboard from the scratch, but we will much rather utilize one of the open-source dashboards already available.
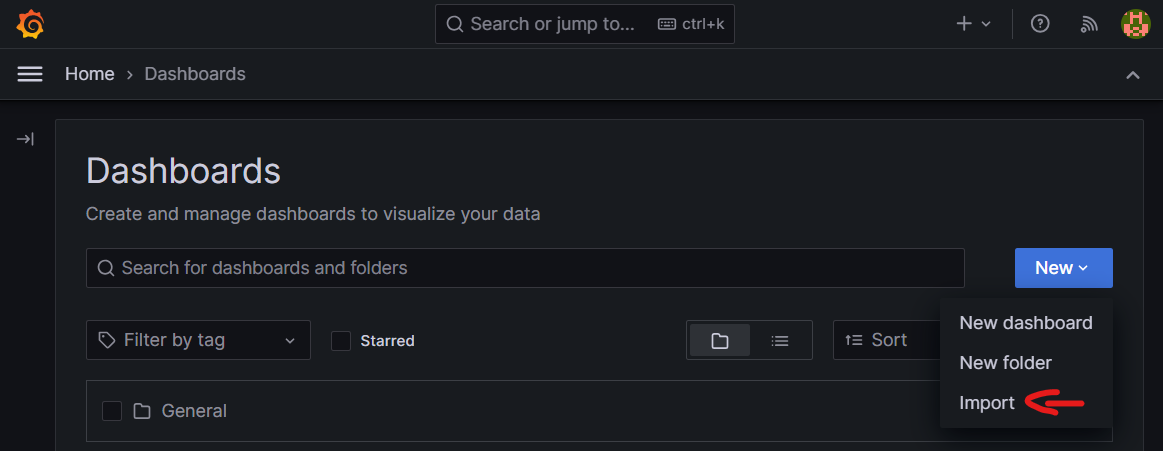
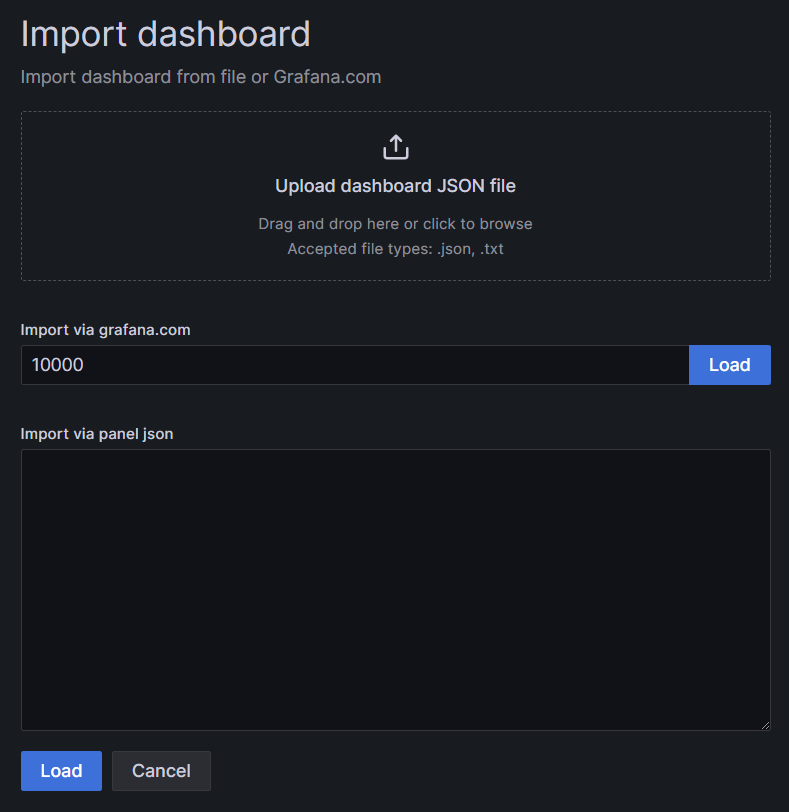
To proceed, select the Dashboards section from the collapsible menu in top left corner and click Import:
Then in the import via grafana.com field, enter 10000, which is the ID of the Kubernetes observability dashboard from the grafana.com marketplace represented in: https://grafana.com/grafana/dashboards/10000-kubernetes-cluster-monitoring-via-prometheus/
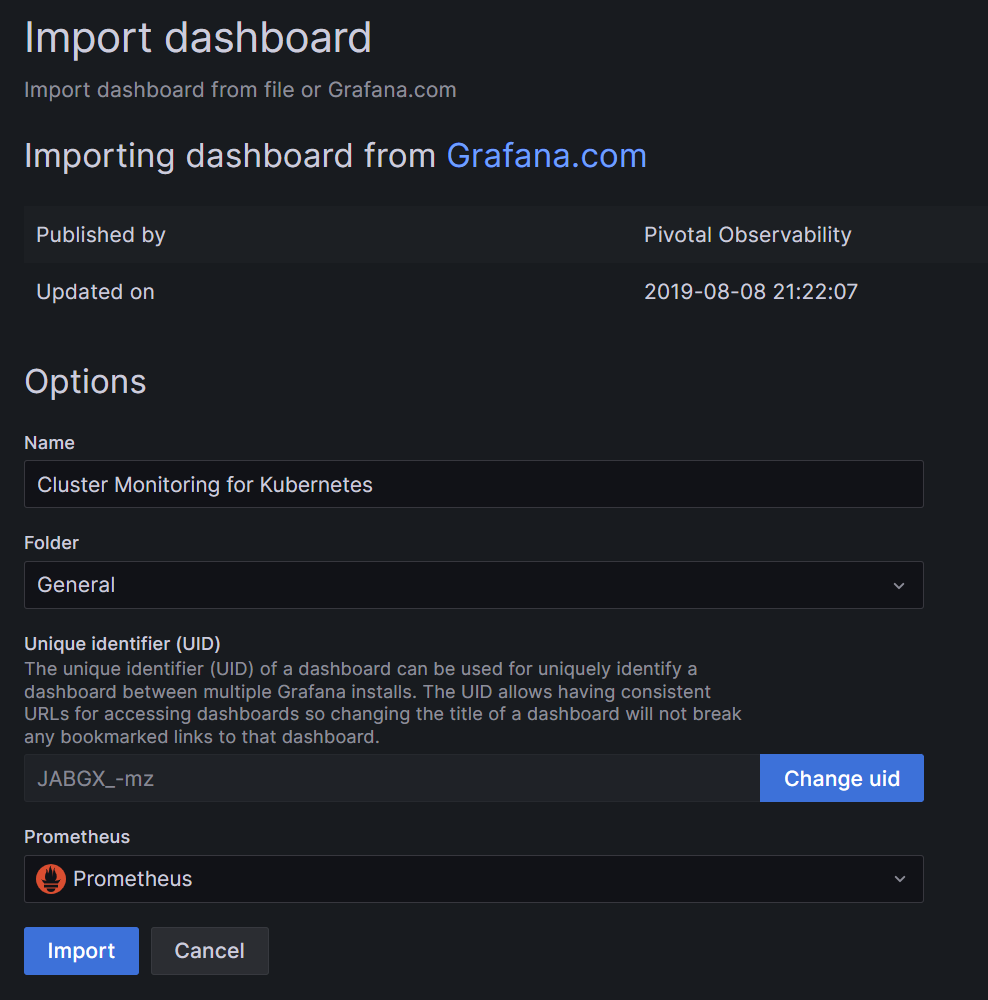
Then another screen appears as per below. Change data source to Prometheus and hit Import button:
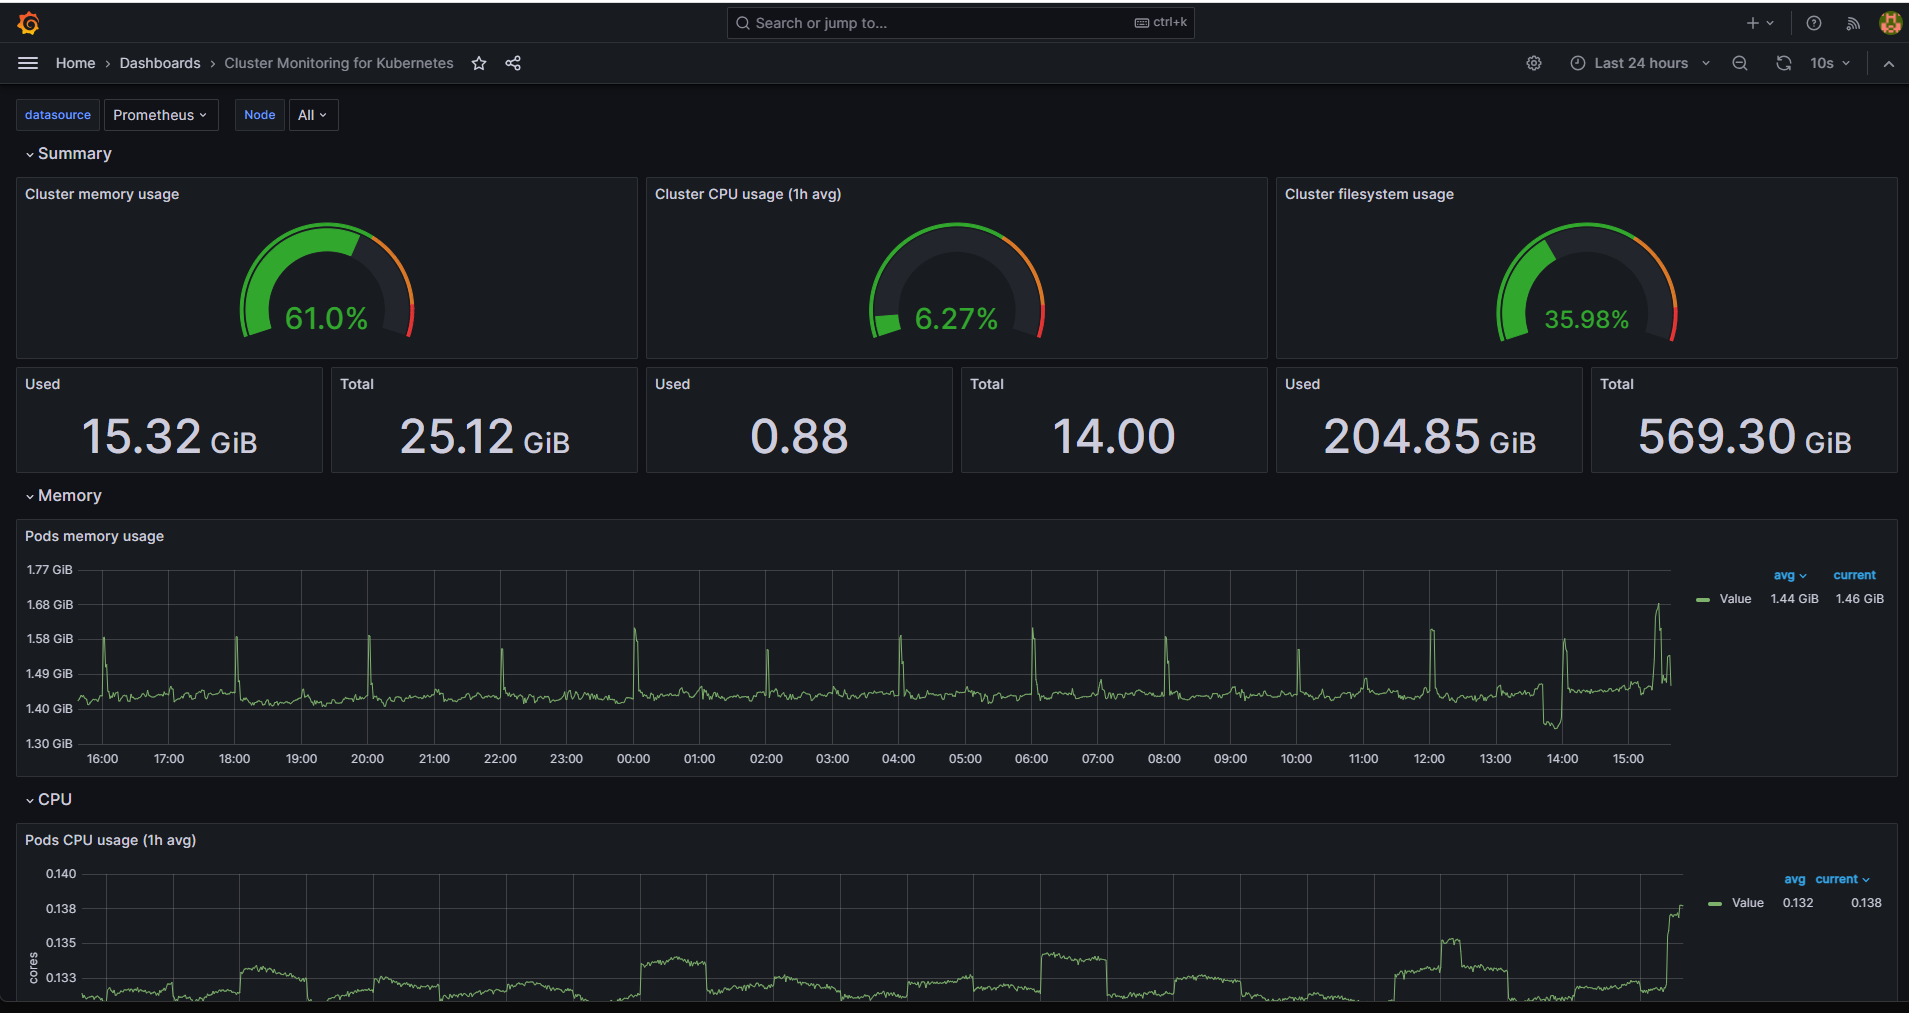
As the result, the Grafana Kubernetes observability dashboard gets populated:
What To Do Next
You can find and import many other dashboards for Kubernetes observability by browsing https://grafana.com/grafana/dashboards/. Some examples are dashboards with IDs: 315, 15758, 15761 or many more.
The following article shows another approach to creating a Kubernetes dashboard:
Using Dashboard To Access Kubernetes Cluster Post Deployment On Creodias OpenStack Magnum