Install and run Dask on a Kubernetes cluster in Creodias cloud
Dask enables scaling computation tasks either as multiple processes on a single machine, or on Dask clusters that consist of multiple worker machines.
Dask scheduler, once presented with a computation task, splits it into smaller tasks that can be executed in parallel on the worker nodes/processes. Dask provides a scalable alternative to popular Python libraries such as NumPy, Pandas, or scikit-learn, while preserving a compact and familiar API.
In this article you will install a Dask cluster on Kubernetes and run Dask worker nodes as Kubernetes pods. As part of the installation, you will get access to a Jupyter instance, where you can run the sample code.
What we are going to cover
Prerequisites
No. 1 Hosting
You need a Creodias hosting account with Horizon interface https://horizon.cloudferro.com/auth/login/?next=/.
No. 2 Kubernetes cluster on Creodias cloud
To create Kubernetes cluster on cloud refer to this guide: How to Create a Kubernetes Cluster Using Creodias OpenStack Magnum
No. 3 Access to kubectl command line
The instructions for activation of kubectl are provided in: How To Access Kubernetes Cluster Post Deployment Using Kubectl On Creodias OpenStack Magnum
All commands in this article assume that kubectl is working and pointing to the correct cluster.
No. 4 Familiarity with Helm
For more information on using Helm and installing apps with Helm on Kubernetes, refer to Deploying Helm Charts on Magnum Kubernetes Clusters on Creodias
No. 5 Python3 available on your machine
Python3 preinstalled on the working machine.
No. 6 Basic familiarity with Jupyter and Python scientific libraries
Installing JupyterHub on Magnum Kubernetes Cluster in Creodias
We will use Pandas as an example.
No. 7 Resources considerations
When it comes to Dask, it may well require much more space for pods than usual. Consider the following:
Container images are large. ghcr.io/dask/dask and dask-notebook pull hundreds of MB each (often 0.5–1.5 GB combined on disk once unpacked).
Each Pod consumes ephemeral disk beyond the image: writable layers, logs, temporary data and emptyDir volumes.
Jupyter adds Python scientific stacks (NumPy/Pandas/etc.) and caches; workers handle shuffle/temp files.
Without explicit ephemeral-storage requests/limits, kubelet cannot budget disk, which often leads to DiskPressure and Evicted Pods on small root disks.
No. 8 Further info on Dask
The official Dask examples gallery is here.
For more advanced tutorials and workflows, see the official Dask documentation.
Step 1 Install Dask on Kubernetes
To install Dask as a Helm chart, first download the Dask Helm repository:
helm repo add dask https://helm.dask.org/
Instead of installing the chart out of the box, let us customize the configuration for convenience. To view all possible configurations and their defaults run:
helm show dask/dask
Prepare file dask-values.yaml to override some of the defaults:
dask-values.yaml
scheduler:
  serviceType: LoadBalancer
jupyter:
  serviceType: LoadBalancer
worker:
  replicas: 4
This changes the default service type for Jupyter and Scheduler to LoadBalancer, so that they get exposed publicly. Also, the default number of Dask workers is 3 but is now changed to 4. Each Dask worker Pod is allocated 1 vCPU and 3 GB of RAM by default, which we keep unchanged in this example.
To deploy the chart, create the namespace dask and install to it:
helm install dask dask/dask -n dask --create-namespace -f dask-values.yaml
The number of workers needed
The number of workers actually running depends on available cluster resources. Even if replicas: 4 is set, you may see fewer (for example, 2 workers) if the nodes do not have enough CPU, memory, or ephemeral-storage to schedule all Pods.
The following list should help you properly gauge resources when creating Dask workers:
Worker replicas |
Recommended node resources |
|---|---|
2 workers |
At least 2 vCPUs, 4 GB RAM, 20 GB disk |
4 workers |
At least 4 vCPUs, 8 GB RAM, 40 GB disk |
8+ workers |
At least 8 vCPUs, 16+ GB RAM, 80+ GB disk |
Step 2 Access Jupyter and Dask Scheduler dashboard
After the installation step, you can access Dask services:
kubectl get services -n dask
There are two services, for Jupyter and Dask Scheduler dashboard. Populating external IPs will take few minutes:
NAME             TYPE           CLUSTER-IP       EXTERNAL-IP      PORT(S)                       AGE
dask-jupyter     LoadBalancer   10.254.230.230   64.225.128.91    80:32437/TCP                  6m49s
dask-scheduler   LoadBalancer   10.254.41.250    64.225.128.236   8786:31707/TCP,80:31668/TCP   6m49s
Note
The values we use here as external IP addresses, 64.225.128.91 and 64.225.128.236, will be different in your case, so be sure to use the actual values you get from running the commands in this article.
Step 3 Accessing Jupyter and the Dask dashboard
Jupyter
Open the external IP of the dask-jupyter Service in your browser.
http://<JUPYTER_EXTERNAL_IP>
You will be redirected to a login page that requires password or a token:
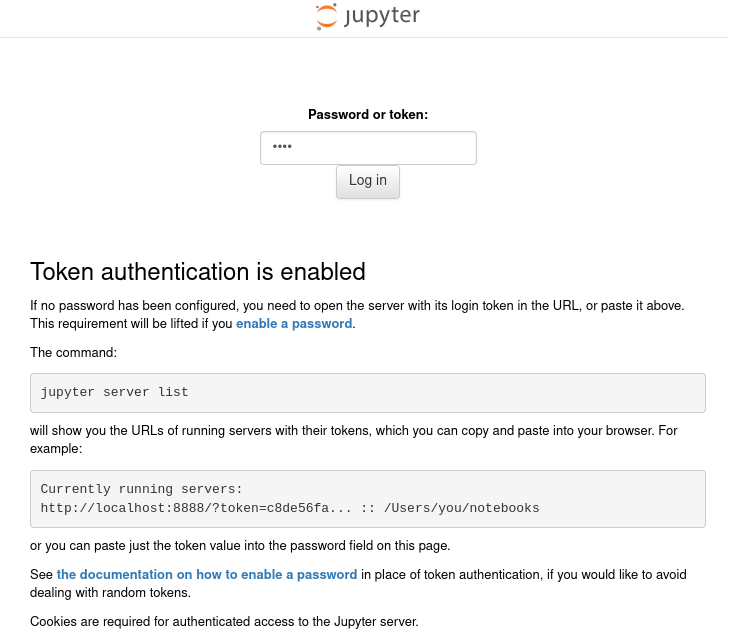
Using token will always work, so here is how to retrieve it:
kubectl -n dask logs deploy/dask-jupyter --tail=200 | grep -m 1 'token='

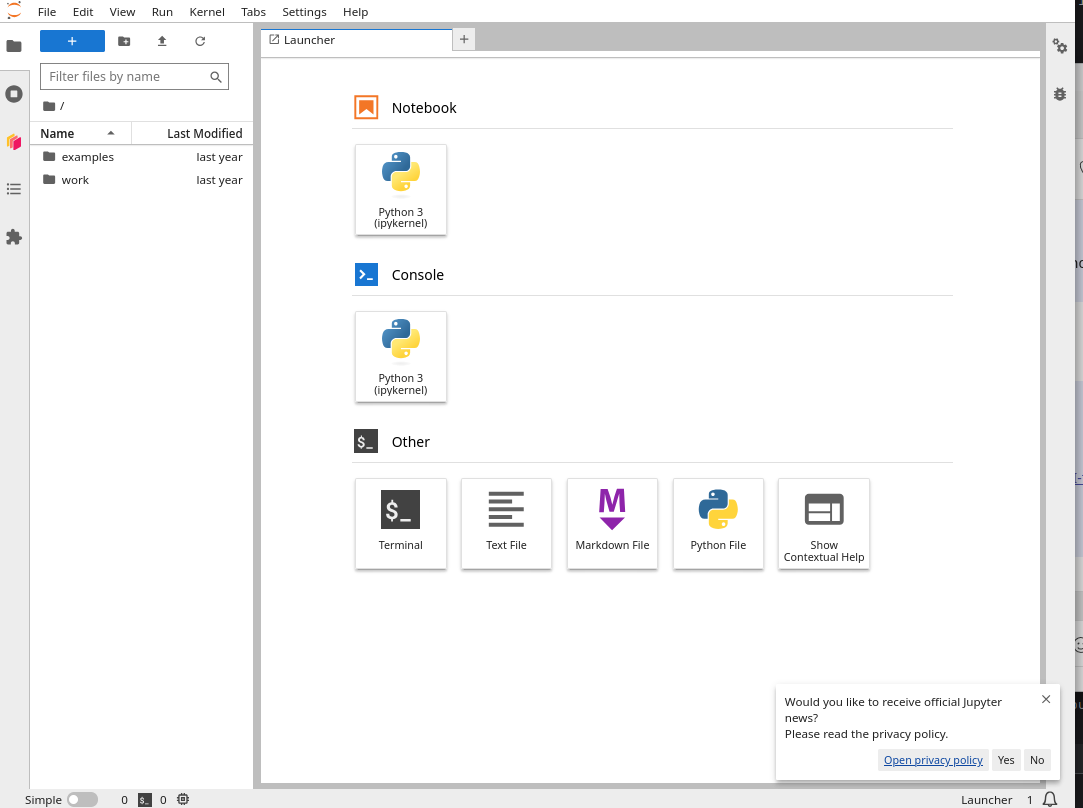
Copy the ?token=… value and paste it into the login form. You will see JupyterLab active on the screen:
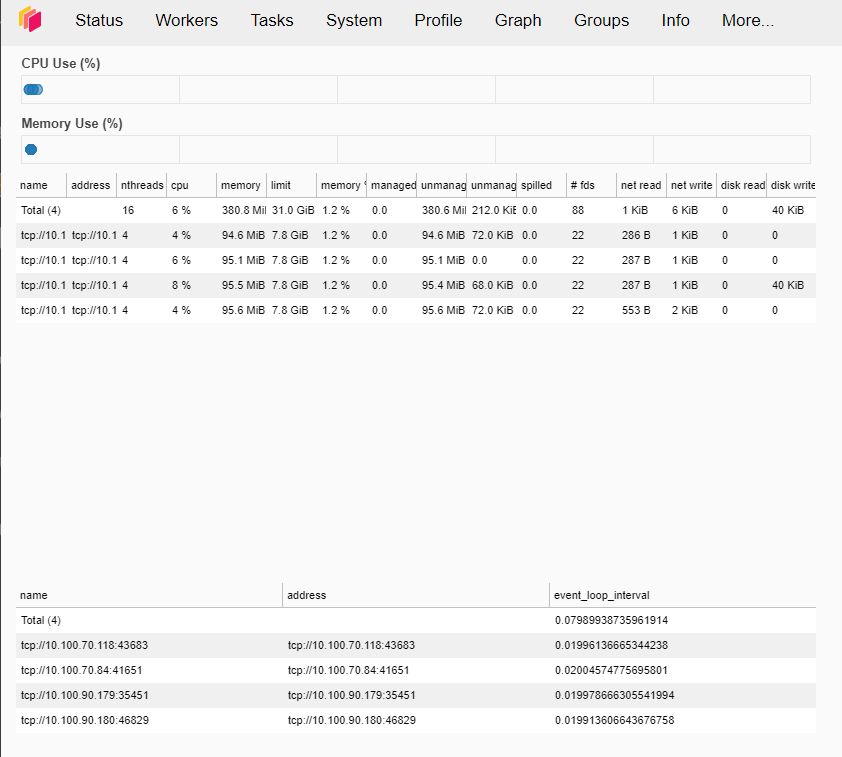
Dask dashboard
Open the external IP of the dask-scheduler Service in your browser, but add /status to the URL:
http://<SCHEDULER_EXTERNAL_IP>/status
Similarly, with the Scheduler Dashboard, paste the external IP to the browser to view it. If you then click on the “Workers” tab above, you can see the workers running on our Dask cluster:
You can use Prometheus/Grafana combo too.
Warning
In production, the Jupyter token should be replaced with a password configured via values.yaml:
...
jupyter:
  password: "StrongPassword123!"
...
Step 4 Run a sample computing task
The installed Jupyter instance already contains Dask and other useful Python libraries.
To run a sample job, first activate the notebook by clicking on icon named NoteBook → Python3 (ipykernel) on the right-hand side of the JupyterLab screen.
The sample job performs a calculation on a table (dataframe) of 1 million rows and one column. Each record will be filled with a random integer from 1 to 100,000 and the task is to calculate the sum of all records.
import dask.dataframe as dd
import pandas as pd
import numpy as np
import time

# Use 1 million rows for a lightweight demo
data = {'A': np.random.randint(1, 100_000, 1_000_000)}
df_pandas = pd.DataFrame(data)
df_dask = dd.from_pandas(df_pandas, npartitions=4)

# Pandas
start_time_pandas = time.time()
result_pandas = df_pandas['A'].sum()
end_time_pandas = time.time()
print(f"Result Pandas: {result_pandas}")
print(f"Computation time Pandas: {end_time_pandas - start_time_pandas:.2f} seconds.")

# Dask
start_time_dask = time.time()
result_dask = df_dask['A'].sum().compute()
end_time_dask = time.time()
print(f"Result Dask: {result_dask}")
print(f"Computation time Dask: {end_time_dask - start_time_dask:.2f} seconds.")
Hit Run or press Shift+Enter to execute the cell. After a few seconds, the result will appear below the code.
Some of the results we could observe for this example:
Result Pandas: 50038048823
Computation time Pandas: ~0.00–0.05 seconds
Result Dask: 50038048823
Computation time Dask: 0.49 seconds.
Notes
Using 1 million rows ensures that the kernel does not crash on small clusters.
If your cluster has more memory and disk available, you can increase the dataset size (e.g. 10M or 100M rows), but very large arrays may cause the Jupyter kernel to restart.
These results are not deterministic and simple Pandas could also perform better case by case. The overhead to distribute and collect results from Dask workers needs to be also taken into account. Further tuning the performance of Dask is beyond the scope of this article.
Scaling the Dask cluster is covered in Step 5. That section explains where helm and kubectl should be executed from and why.
Step 5 Scale the number of Dask workers
Scaling the Helm release should be done from the same machine where kubectl access to the cluster is configured.
The Jupyter pod from the Dask Helm chart is intended for running notebooks and does not necessarily include tools such as helm.
Scale workers with Helm (persistent)
To change the number of workers and keep the change persistent across upgrades, run:
helm upgrade dask dask/dask -n dask --reuse-values --set worker.replicas=5
kubectl --request-timeout=60s -n dask rollout status deploy/dask-worker --timeout=120s
The number of workers can be verified at different levels:
at the Kubernetes level – using kubectl, and
at the Dask level – using the scheduler.
Both approaches are shown below for completeness.
Confirm the worker count:
kubectl --request-timeout=60s get deploy -n dask dask-worker
kubectl --request-timeout=60s get pods -n dask | grep dask-worker
You should see one worker Pod per replica.
Note
If you see an error such as Unable to connect to the server ... i/o timeout,
it usually indicates a transient connectivity issue to the Kubernetes API endpoint.
Re-run the command with the explicit client timeout shown above.
Optional: scale workers with kubectl only (not Helm-persistent)
This method updates the running Deployment only and does not modify Helm values.
If you only need a temporary scale change, you can scale the Deployment directly:
kubectl -n dask scale deployment/dask-worker --replicas=5
kubectl -n dask rollout status deploy/dask-worker --timeout=120s
This method is convenient for quick tests, but future helm upgrade operations may overwrite the replica count.
Confirm workers from Python
From Jupyter, connect to the scheduler and confirm workers:
from dask.distributed import Client

client = Client("tcp://dask-scheduler.dask.svc.cluster.local:8786")
print("Workers visible to scheduler:", len(client.nthreads()))
Common issues
If workers don’t start, check cluster resource limits and node disk space.
If kernel dies, reduce dataset size or increase worker memory.
If LoadBalancer IP doesn’t show, wait or verify cloud provider quota.
Before going to production
Steps above are suitable for demos / small clusters.
In production, you should at the very least:
Configure persistent volumes for worker temporary storage.
Use proper resource requests/limits (CPU, memory, storage).
Secure Jupyter with passwords + TLS.
What To Do Next
Now that you have a running Dask cluster with Jupyter and the Scheduler dashboard, you may want to explore further:
Enable monitoring For long-running clusters, consider enabling monitoring with Prometheus and Grafana. See article Kubernetes cluster observability with Prometheus and Grafana on Creodias.
Run larger computations Try scaling the dataset size in your notebooks to see how performance changes with more workers.
Scale the cluster dynamically Use helm upgrade or the Python script from Step 5 to increase or decrease the number of workers depending on your workload.
Use Dask with real data Connect to object storage or databases in your Creodias cloud project and process large datasets with Dask.
Secure Jupyter access Change the default token/password in values.yaml for production use.
Explore integrations Dask works well with libraries such as Xarray, RAPIDS, or Scikit-Learn. Try running a machine learning or geospatial workflow on your cluster.
Automate deployments Integrate the Helm chart into your CI/CD or Infrastructure-as-Code setup for reproducible cluster creation. See CI/CD pipelines with GitLab on Creodias Kubernetes - building a Docker image.
These steps will help you go beyond the demo and use Dask effectively for real workloads in your Kubernetes environment.