Billing Reports on Creodias
Monitoring cloud costs regularly helps you manage resource consumption and optimize spending. In the Creodias Dashboard, under Billing and Reporting → Billing Reports, you can view your usage and costs in two distinct ways:
- Billing Reports by Product
Financial overview
Summarizes what type of services were used
- Billing Reports by Resource
Technical breakdown
Explains which exact instances consumed the resources.
Both reports use the same underlying data but differ in how the information is grouped and displayed.
The following example from November 2025 illustrates these differences in detail.
What we are going to cover
Prerequisites
No. 1 Hosting account
You need an active Creodias hosting account with access to the Horizon interface: https://horizon.cloudferro.com/auth/login/?next=/. There should be some active content in the account, in a particular cloud and in a particular period of time.
No. 2 Dashboard ready to use
Access to Dashboard using link https://new.cloudferro.com/. For activation of the account, see the following articles:
Check active resources in Horizon
We will now gather data about the instances we used so that we can see the exact cost, using either of the billing reports options.
Before comparing billing reports, it helps to know which instances and flavors are active during the billing period. You can check this in Horizon → Compute → Overview → Usage Summary, as shown below.
Enter Horizon through the usual link https://horizon.cloudferro.com/auth/login/?next=/.
Select the cloud you want to work with – here it will be waw4-1.
Use command Compute -> Overview and scroll to the bottom of the browser window to see Usage Summary.
Set up the time period, here it is from the first to the last day of November 2025.
Table Usage displays instances active on that cloud in that period:
Decide which resources you want to investigate further
As an example, click the name of the first instance and see which flavor it uses. You can directly see which resources are used on that cloud, in that period of time, and, consequently, you will be able to see how much they cost.
Open Billing Reports in Dashboard
Enter the Dashboard via https://new.cloudferro.com/ and click on Billing and Reporting -> Billing Reports. This is the starting form to enter the data into:
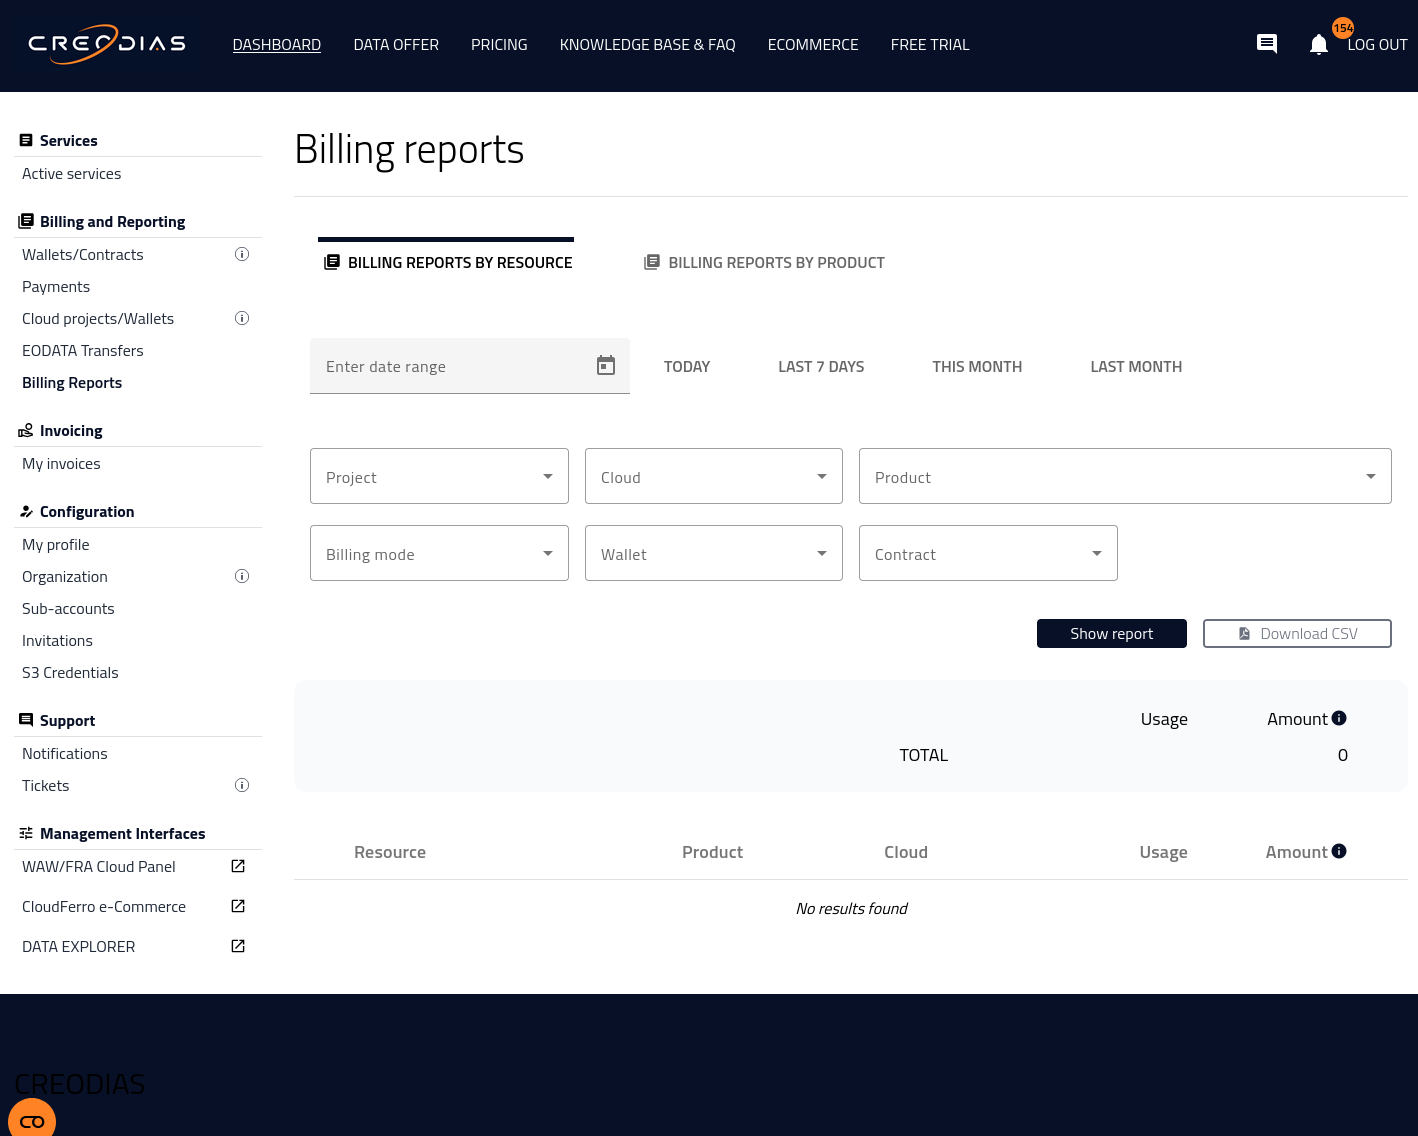
Billing reports screen
Define report filters
The same filter panel is used for both report types. It defines the time window, project, and cloud, and allows you to narrow your report by product, billing mode, and wallet.
Filters include:
Date range – Select manually or use quick presets (Today, Last 7 Days, etc.).
Project – Choose one of your OpenStack projects.
Cloud – Available regions include FRA1-2, WAW3-2, waw3-1, and waw4-1.
Product – Combination of cloud and product type (e.g. waw4-1 / eo2a.small). Use search files to narrow down the number of options.
Billing mode – PPU, PAYG, or FIXED-TERM.
Wallet / Contract – Payment source or predefined contract.
When done, click on Show report and wait for a couple of seconds. What is shown below that button will depend on which of the two options for billing you have selected.
Note
Product — a service category such as a VM flavor (eo2a.small, eo2a.large) or an object storage type (S3).
Resource — an individual instance or object created under that product type (for example, one virtual machine or one storage bucket).
Billing Reports by Product
In this view, all usage and costs are grouped by product type — such as virtual machine flavor or storage service. Each product represents a service category and the total usage for all resources of that type is aggregated.
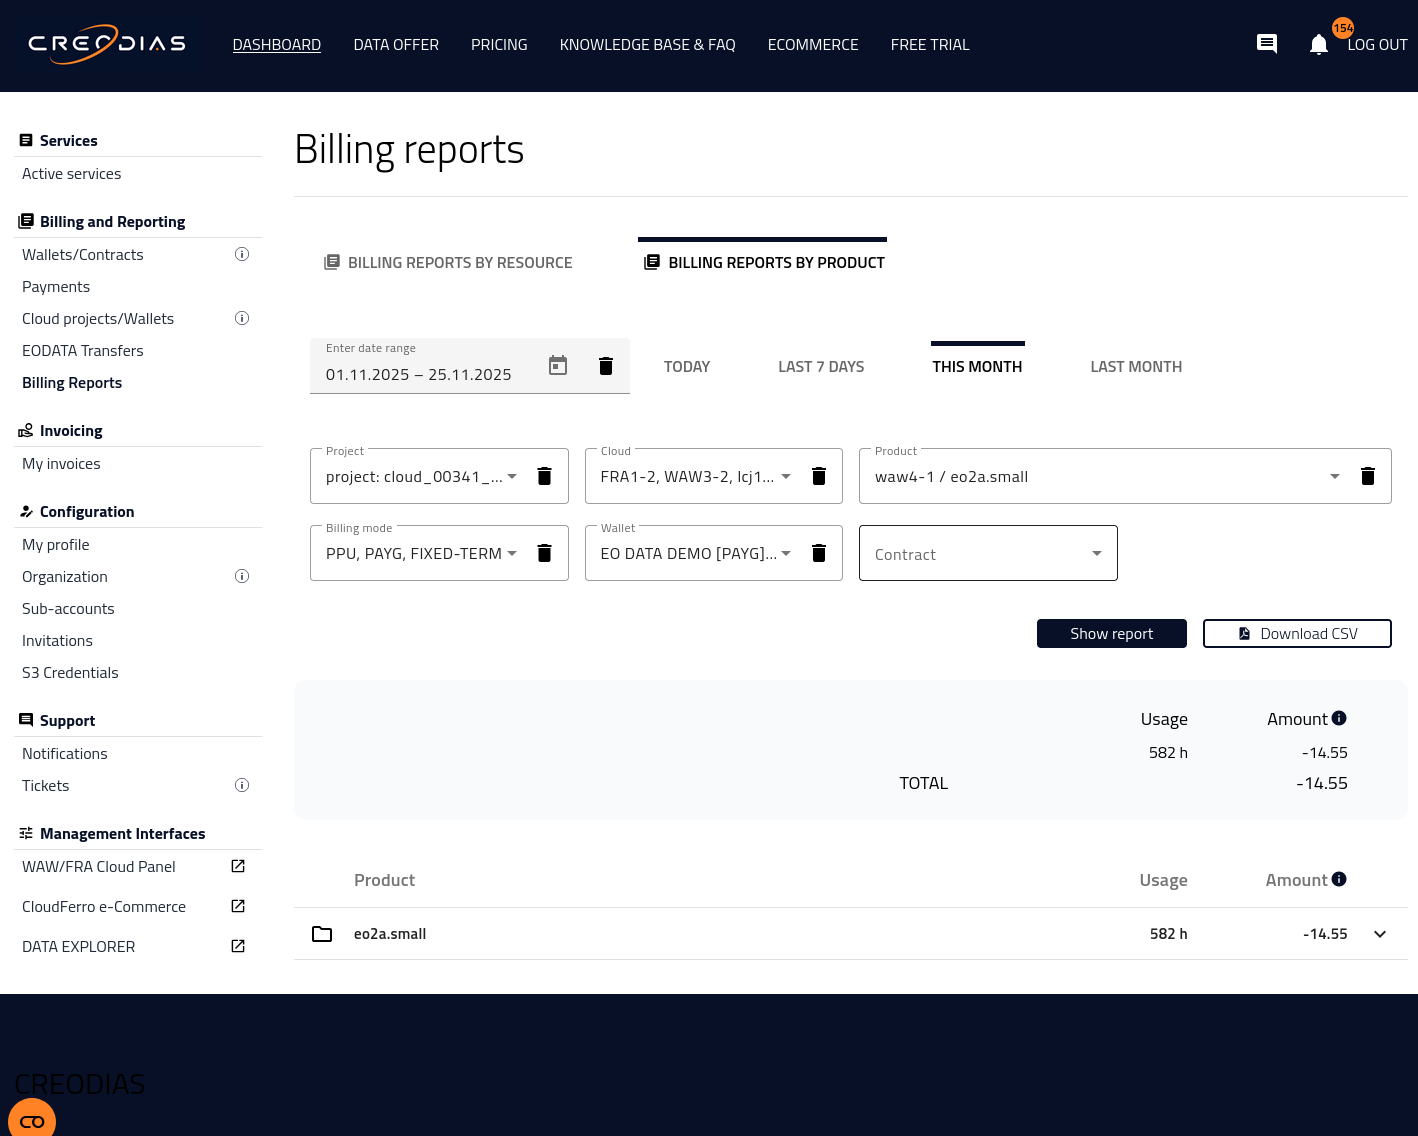
Billing report grouped by product type.
This report provides a summary-level view ideal for accounting, budgeting, and tracking overall spending per service. For instance, if you operated several eo2a.small and eo2a.large, this view will show only the total usage and cost for each flavor type.
Billing Reports by Resource
In contrast, the Billing Reports by Resource view lists each individual resource (such as a virtual machine or storage bucket) that contributed to the totals. Each line item includes a unique resource ID corresponding to an object in your OpenStack project.
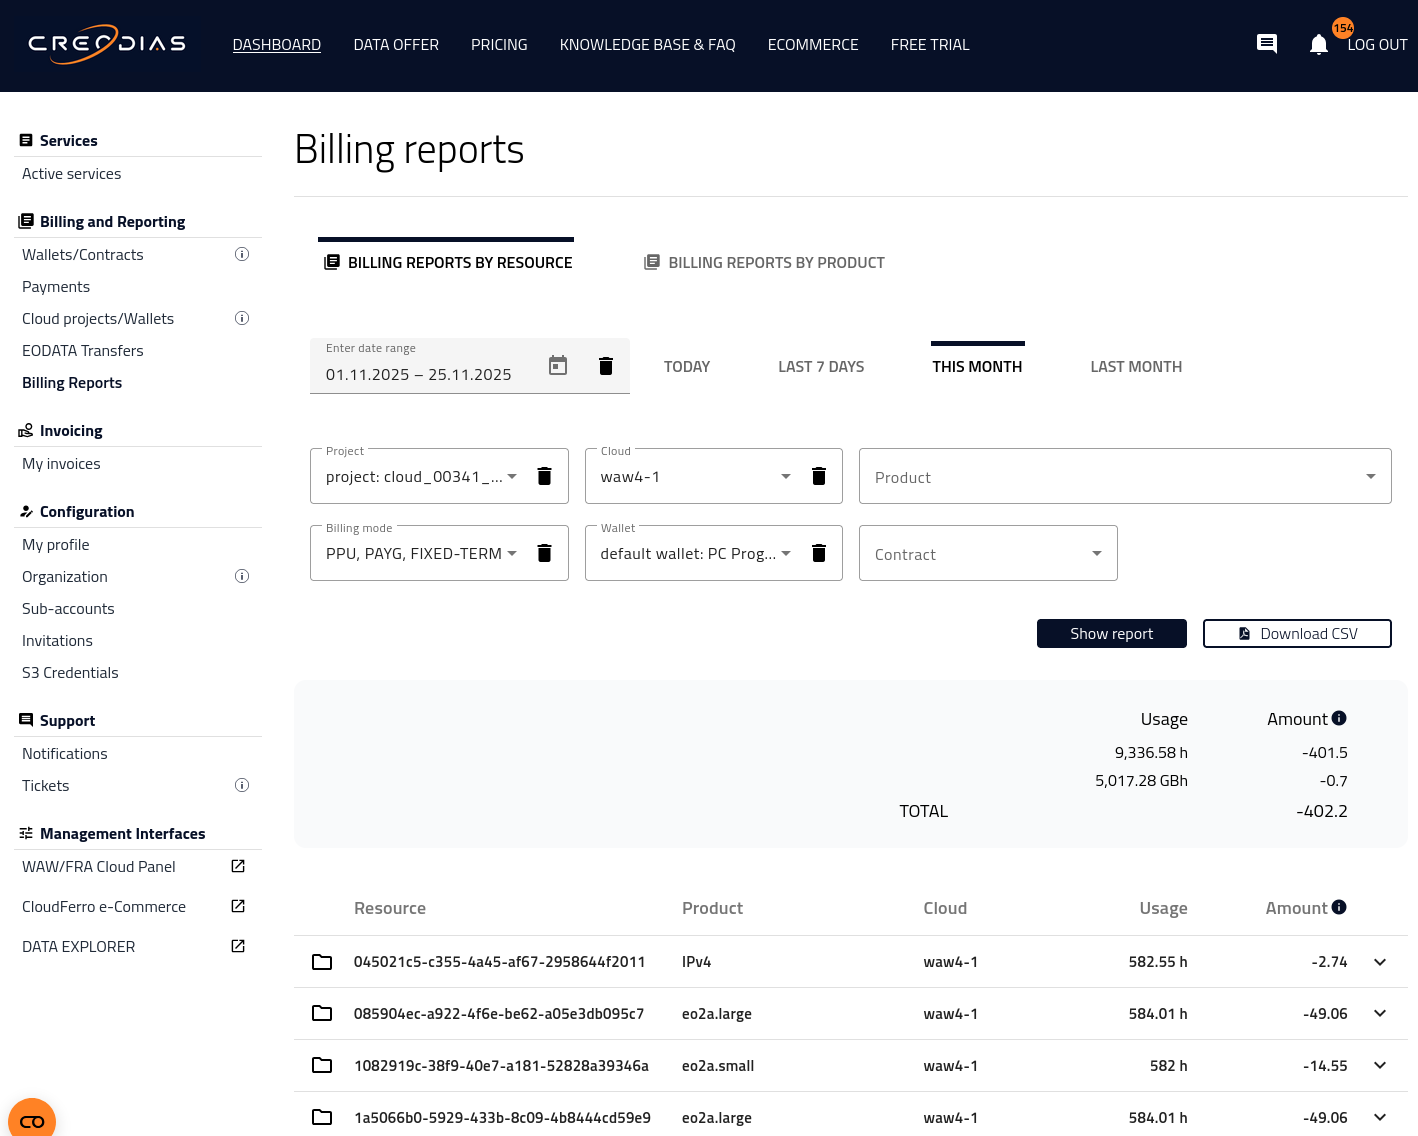
Billing report grouped by individual resources — each VM and storage bucket itemized separately.
While the overall usage and total cost remain the same, the resource-based report provides fine-grained visibility into how those totals were generated.
This is especially helpful when you need to:
Audit which specific VMs or storage buckets consumed resources.
Reconcile usage between teams or projects.
Identify underutilized or idle resources.
Both reports yield identical totals, but differ in aggregation level.
When to Use Each Report
Goal |
Recommended Report |
|---|---|
Check total monthly compute spending |
Billing by Product |
Identify which VM caused unexpected costs |
Billing by Resource |
Prepare finance or accounting summaries |
Billing by Product |
Audit or troubleshoot specific workloads |
Billing by Resource |
Compare the Two Report Types
Aspect |
Billing by Product |
Billing by Resource |
|---|---|---|
Grouping basis |
Product type (e.g., VM flavor, storage) |
Individual resource (VM, bucket, volume) |
Level of detail |
Summary/aggregated view |
Detailed, instance-level view |
Ideal for |
Accounting, budgeting, cost forecasting |
Technical audits, troubleshooting |
Example grouping |
eo2a.small, eo2a.large, Object Storage |
VM IDs, bucket names |
Total cost visibility |
Overall cost per product |
Cost breakdown per resource |
Purpose |
Understand total spending per service type |
Investigate detailed usage per VM or bucket |
Practical Use Cases
- Billing by Product
Estimate total monthly spending on specific VM flavors or services.
Simplify financial reporting and budgeting.
Track cost per product category (compute, storage, etc.).
- Billing by Resource
Identify high-cost virtual machines or storage buckets.
Audit specific projects or workloads.
Verify that all terminated resources stopped generating charges.
Best Practices
Tip
Combine both reports in your monthly review — start with Billing by Product for a quick overview, then use Billing by Resource for detailed cost attribution.
Export both reports as CSV files and archive them monthly for audit and trend analysis.
In summary, Billing by Product provides a concise financial view of your cloud usage, while Billing by Resource breaks those costs down per instance or bucket.
Both reports use identical data, giving you flexibility between financial overviews and technical audits.